
In Q3 2025, managed vehicles recorded net inflows of $827.4 billion, according to data from ISS MarketPulse powered by Simfund Total Market. This marked a solid increase over the second quarter, when funds raised $695.8 billion. ETFs were the strongest contributor to net deposits in the third quarter, followed by mutual funds, which saw net inflows exceeding $200 billion.
- Industry Overview by Asset Class and Vehicle

ETF net inflows in the third quarter totaled $529.5 billion, a significant increase over the second quarter’s $389.6 billion. Equity ETFs were the primary drivers of this growth, attracting $314.5 billion over the quarter. Passive ETFs captured the largest share of net flows at $384.2 billion. While active ETFs had assets under management of only $1.6 trillion, just one-tenth of the $16.7 trillion held by passive ETFs, active ETFs posted a respectable $145.3 billion in new deposits. ETFs based in the United States accounted for the largest portion of inflows, clocking in at $351.9 billion in inflows. Within passive ETFs, U.S. funds brought in $223.7 billion, a sizeable lead over the $73.5 billion for ETFs domiciled in Ireland, which serves as a hub for European funds. The dominance was even stronger in active ETFs, where U.S. funds attracted $128.2 billion, far ahead of Ireland’s $7.7 billion.
Mutual funds experienced the second highest quarterly inflows in Q3, reaching $284.8 billion, up from $230.9 billion in Q2. These gains were largely driven by money market funds, which have been the primary source of positive flows in recent quarters. Excluding money market funds, long-term mutual funds struggled, recording steep outflows of $37.5 billion after strong inflows of $41.9 billion in the previous quarter. Other pockets of demand emphasized conservative positioning as bond funds saw inflows rise to $207.1 billion from $171.6 billion in Q2. Equities, conversely, remained under pressure, suffering withdrawals of $229.1 billion, most of which came from active funds ($166.7 billion). U.S.-based equity funds saw the sharpest losses, with outflows totaling $193.2 billion for the quarter.
Collective investment trusts saw net commitments of $61.2 billion in Q3 2025, down from $102.3 billion in Q2. Allocation funds, primarily in the form of target-date funds, accounted for the bulk of inflows at $45.0 billion, though this was lower than the $58.1 billion recorded in the previous quarter. Money market funds contributed the second most for the quarter at $7.4 billion after facing outflows of $1.9 billion in Q2. All other asset classes also posted positive flows, but at levels well below those seen in Q2.
Retail separately managed accounts recorded $40.4 billion in inflows during Q3, a sharp rebound from $9.1 billion in Q2, though still below the $50.3 billion seen in Q1. Fixed income strategies led with $19.3 billion, up from $7.1 billion in the prior quarter. Equity products posted positive inflows of $11.2 billion after minor outflows of $14.0 million in Q2. Institutional separate accounts continued to face heavy redemptions, with net withdrawals surging to $88.6 billion, more than double Q2’s $36.1 billion. Within this segment, fixed income attracted $27.1 billion in inflows, but equity strategies suffered the most, with massive outflows totaling $113.7 billion.

Money market funds were the largest source of mutual inflows over the third quarter. Money market funds focusing on short-term U.S. securities gathered the most for mutual funds with inflows of $219.4 billion, a stark boost after Q2’s minor net deposits of $1.4 billion. The Asia Money Market category ranked second with $57.7 billion in net inflows, although this was a decline from the strong $138.3 billion recorded in the previous quarter. Additional inflows came from U.S.-based prime funds ($21.3 billion) and European money market funds ($13.5 billion).
Fixed income strategies delivered the second-highest mutual fund net deposits in Q3, totaling $207.1 billion, up from $171.6 billion in Q2. Activity was strongest in global markets, with Global Fixed Income recording the third highest net commitments for the quarter at $57.1 billion, a sharp turnaround from Q2’s redemptions of $2.4 billion, driven largely by Ireland-domiciled funds. Europe Fixed Income also recorded positive inflows of $46.6 billion. Among other fixed income categories, Intermediate Core Bond rebounded from $4.6 billion outflows in Q2 to positive flows of $32.6 billion in Q3. Another U.S.-focused intermediate-term strategy, Core-Plus Bond, recorded net deposits of $12.2 billion, up from $3.4 billion the prior quarter. Multisector Bond ($25.3 billion) and Emerging Market Fixed Income ($12.3 billion) strategies also improved significantly, having respectively witnessed inflows of $4.7 billion and outflows of $1.2 billion the prior quarter.
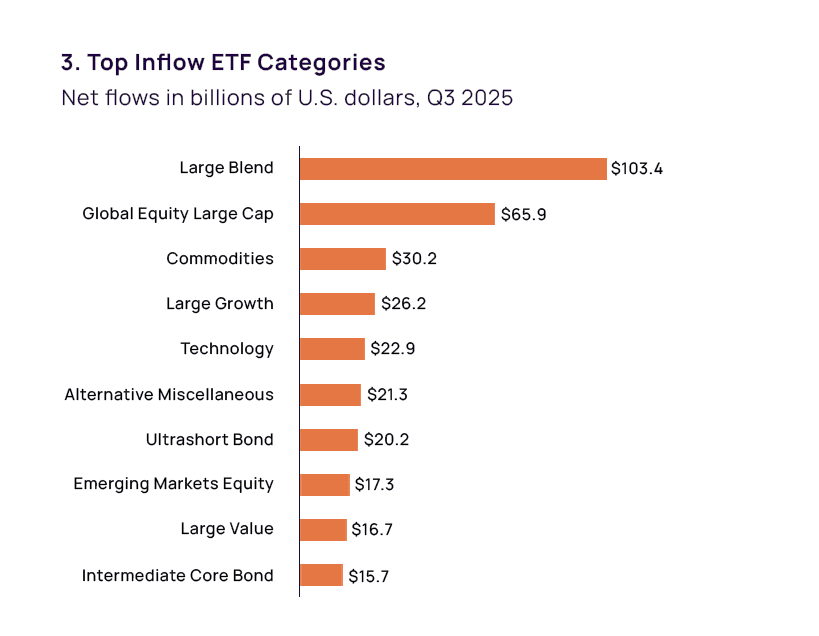
Equity ETFs remained the primary driver of inflows in Q3, attracting $314.5 billion, up sharply from $204.6 billion in Q2. Large-cap strategies led the surge, with Large Blend posting net deposits of $103.4 billion, well ahead of Global Equity Large Cap’s $65.9 billion. Within Large Blend, U.S.-domiciled funds dominated with $80.4 billion, followed by funds based in Ireland ($13.5 billion) and Canada ($4.9 billion). Global Equity Large Cap saw a slight uptick from Q2, with U.S.-based funds contributing $35.6 billion and Ireland-domiciled funds adding $21.2 billion. BlackRock led Large Blend inflows with $44.0 billion, closely followed by Vanguard at $36.8 billion. However, in Global Equity Large Cap, Vanguard took the lead with $23.1 billion, ahead of BlackRock’s $11.8 billion. Other large-cap segments also posted gains, including Large Growth ($26.2 billion) and Large Value ($16.7 billion). Beyond large-cap strategies, Technology ($22.9 billion) and Emerging Markets Equity ($17.3 billion) also attracted positive flows.
Non-traditional strategies also contributed positively. Commodities led the segment with net commitments of $30.2 billion, a notable jump from $17.8 billion in Q2. U.S.-domiciled funds accounted for $17.5 billion of these inflows. Fixed income ETFs delivered strong results as well, attracting $153.9 billion in Q3 compared to $123.9 billion in the prior quarter. Among fixed income strategies, Ultrashort Bond funds brought in the most at $20.2 billion, while Intermediate Core Bond funds added $15.7 billion. BlackRock led Ultrashort Bond inflows with $8.5 billion, while Vanguard topped Intermediate Core Bond with $9.6 billion.
Part two is coming soon, covering retail SMAs, CITs, and separate accounts.
We’re committed to bringing our clients ongoing insights from this expanded dataset and illustrating how this data enables firms to spot opportunities, analyze fund flows across vehicle types, or conduct customized benchmarking. Contact us here or through a Sales or Client Success representative, and visit our MarketPulse site to learn more.
Authors:
Alan Hess, Vice President, U.S. Fund Research, ISS Market Intelligence
Antara Maity, Senior Associate, U.S. Fund Research, ISS Market Intelligence
Aishwarya Mahalingam, Associate, U.S. Fund Research, ISS Market Intelligence