Across the investment management landscape, asset managers must contend with pressures like aging demographics and increased passive competition pushing stalwart strategies, particularly domestic equity ones, into net outflows. Bond funds, conversely, remain a positive-sum environment for active and passive funds, with the asset class experiencing its second highest year of inflows on record in 2025.
Taxable and municipal bond funds experienced net inflows of $581.6 billion in 2025, an annual total behind only 2021’s $645.7 billion. This continued a steady recovery in the wake of 2022, which represented the Federal Reserve’s most aggressive tightening cycle in 40 years and the fund industry’s worst year of fixed income outflows ($321.3 billion).
As that recovery has continued, ETFs have led the charge, albeit at a less extreme pace than in U.S. equity. Passive U.S. equity assets have surpassed those for active funds for multiple years running, but only in 2025 did passive ETF assets specifically grow past assets in active mutual funds. Active mutual funds retain a stronger advantage within fixed income, with more than $4 trillion in assets at the end of 2025. Still, ETFs are quickly making up ground. Bond funds grew assets by $1.6 trillion between 2020 and 2025, of which ETFs accounted for $1.2 trillion. Active bond mutual funds increased assets by only $46 billion over that period.
The mutual fund’s place as the legacy vehicle for many strategies, including fixed income exposure, left it uniquely vulnerable to redemptions in 2022. Lower appreciation in bond funds compared to equity also slowed the structure’s rebound. Further adding to pressure, improved tax treatment in ETFs meant that investors have an incentive to choose that vehicle when returning to bond investing.
Shared positive demand
While asset growth was mild for active mutual funds in the United States over the past five years, fixed income has continued as a positive-sum environment across vehicles and approaches. The table below includes cumulative net new flows to taxable and municipal bond funds over the past decade. Passive ETFs are far and away the winner, as they are elsewhere in the investment management landscape, but other vehicles put up respectable numbers. The difficulty passive funds have in fully replicating their indexes, due to the sheer number of securities involved and their limited availability, has left a designated spot for active funds.
Bond Funds Record Positive Demand Across Vehicles
Cumulative net new flows to bond mutual funds and ETFs, 2016-2025
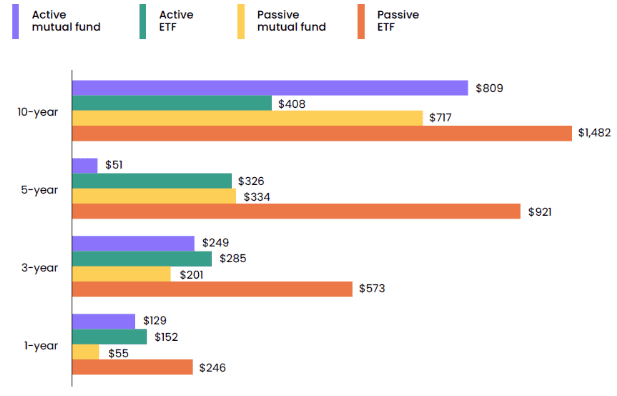
Note: Figure excludes funds of funds, interval funds, and tender offer funds.
Active mutual fund flows remained positive over the past five years, even when including the depths of 2022, thanks to high and persistent demand during other years. Since 2022, active mutual funds and ETFs have seen similar aggregate levels of demand, an impressive feat given the lower asset base for ETFs. Net deposits for bond active ETFs surpassed those for active mutual funds for the first time in an upward-trending market in 2025. While active ETF flows were greater than those of mutual funds in 2022 and 2023, this was the period when legacy structure saw net redemptions.
Pressure, however, continues for firms on the margin. More bond managers operate within active mutual funds than anywhere else but saw that total decline over the past five years, while the number of firms operating in active ETFs more than doubled. See the full report, now available to subscribers on the MarketSage research platform, to learn more about developments in the bond fund market.