
The registered fund industry has seen an absolute proliferation of products in the 2020s. Inceptions for new active ETFs through September 2025 surpassed their previous annual record with multiple months left in the year. There are now more ETFs than there are listed stocks in the United States. While early movers have gained outsized advantages in multiple arenas, this wave of development is not without its potential costs. Each launch adds pressure on the wider intermediary and operational support ecosystem.
ETFs have dominated industry attention. Growth has been strongest in passive ETFs, which accounted for $11.3 trillion in assets as of September. Active ETF growth has nonetheless come together in rapid fashion. They crossed $1 trillion in assets earlier this year and have doubled their market share of ETFs in three years from 5.2% in September 2022 to 10.7% in 2025. Additionally, active ETFs have fully supplanted active mutual funds as the engine of new product development. New ETF launches surpassed those for funds in 2022, and that gap has only widened while keeping liquidations and mergers much more contained.
The structural advantages of ETFs, namely lower costs and improved tax efficiency, have been key factors driving the shift of product development from mutual funds. Technical benefits might, however, only be useful to managers if they drive investor behavior. Fortunately, those precise benefits are driving increased advisor interest in ETFs, with intermediaries citing cost and tax efficiency as their leading reasons for choosing both active and passive ETFs, according to ISS MI’s Advisor Pulse series.
This interest in ETFs is additionally increasingly focused on novel products. Throughout the prior decade, new products faced much heavier headwinds out of the gate. Prior ISS MI research discovered significant declines in aggregate assets raised by new products during the late 2010s. Managers throughout that period explored ways to port popular existing strategies to the active ETF structure. As active ETF growth has accelerated in the new decade, that growth has been exceptionally concentrated within newer launches, as seen in the table below. Active ETFs incepted after 2021 accounted for just shy of $500 billion of the vehicle’s recent growth spurt—nearly double all assets held in active ETFs at the end of 2022 and well beyond the amounts gathered by other segments.
New Products Lead Asset Growth
Growth in active ETF assets in billions of dollars by fund launch year, December 2022 – September 2025
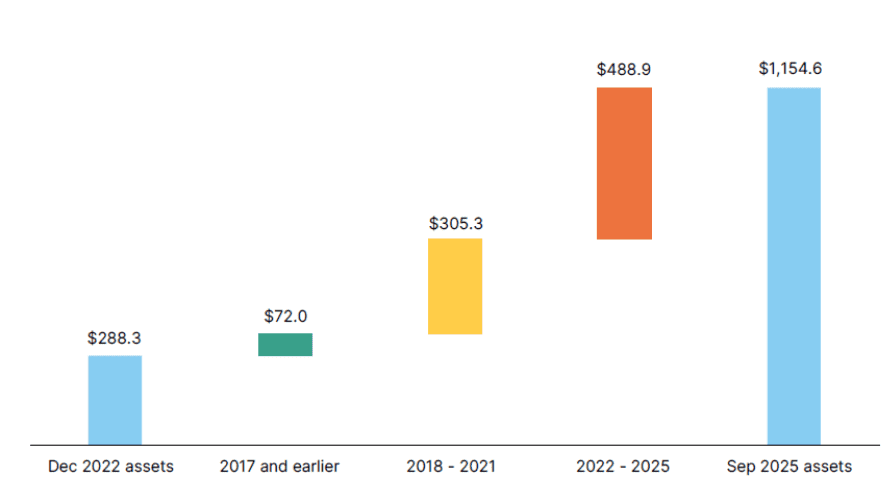
Note: Data excludes ETFs converted from mutual funds.
The full report is available to subscribers on the MarketSage research portal. For more information about this report, or any of ISS MI’s research offerings, please contact us.
Author: Alan Hess, Vice President, U.S. Fund Research, ISS Market Intelligence