

Historical ETF Analytics and 13F Ownership
Helping you move from product screening to prospect identification.
Identify the products that represent the strongest opportunities for replacement, and the advisors with allocations.
The MarketPulse 13F Revenue Opportunities dashboard provides an analytical starting point for ETF distribution.
Spot the competitor funds that are lagging your returns, are more expensive, or losing assets, then pinpoint the distributors invested in those funds.
Prioritize prospects invested in a strategy where yours has a measurable competitive advantage and build an informed replacement story before outreach begins.
13F Revenue Opportunities Dashboard
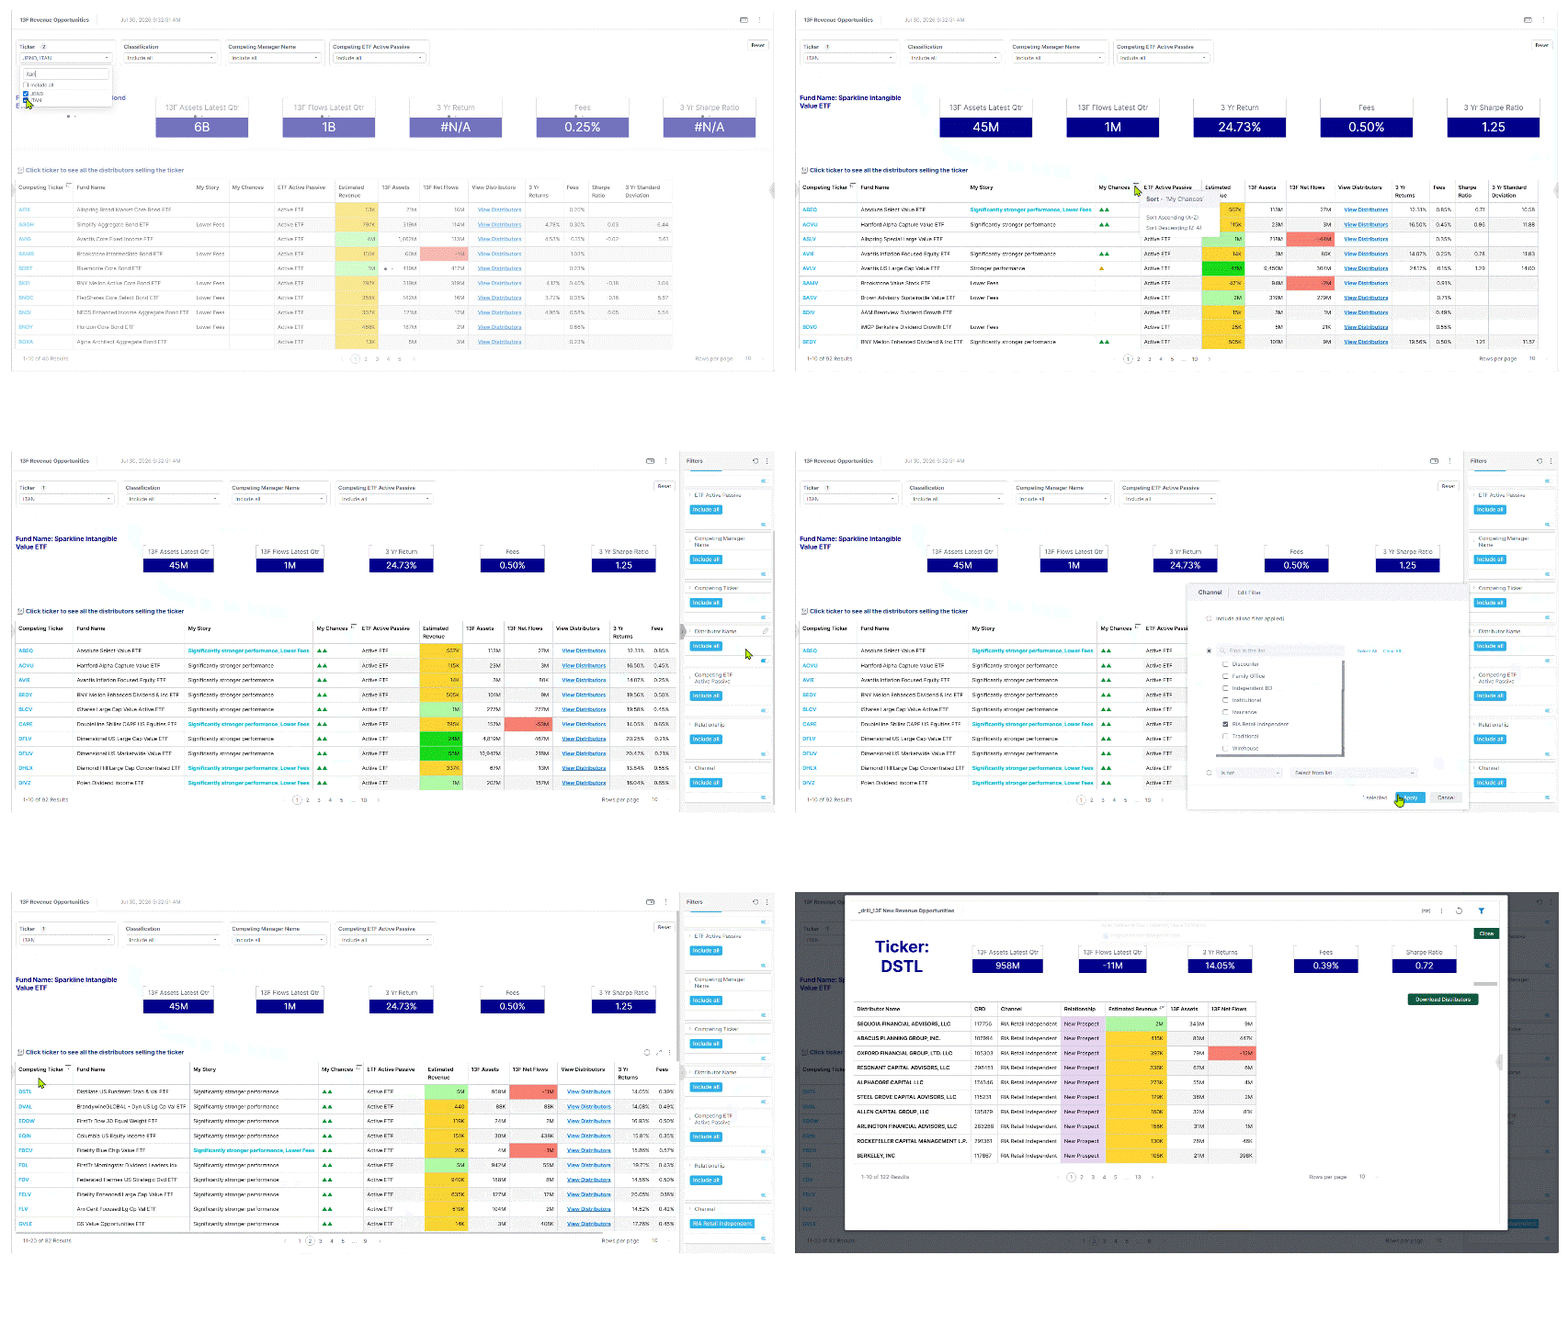
Identify Your Competitive Universe and See 13F Ownership by Fund and by Channel
Compare your ETF to the relevant universe in one easy step.
Sorting and filtering options allow you to quickly organize the results for analysis based on the criteria important to you.
Click on any competing ticker to see each distributor (including their CRD) with a position in that ETF, the size of their allocation, recent flows, and your estimated revenue potential.
Sorting and filtering options allow you to quickly organize the results for analysis based on the criteria important to you.
Click on any competing ticker to see each distributor (including their CRD) with a position in that ETF, the size of their allocation, recent flows, and your estimated revenue potential.
Why MarketPulse for ETF Intelligence
Competitive Edge
Firm CRDs attached to each distributor allow MarketPro users to connect to decision-maker contact data.
Lead Seeker
Focus sales efforts on distributors with allocation gaps and replacement opportunities.
Flow Tracker
See who owns what, how much, and when they bought to understand trends and predict behavior.
Fund Filing
With MarketPulse’s Fund Filing, monitor ETF registrations, launches & liquidations, manager and fee changes, and more.
Complete Coverage
ETF universe enriched with performance, 13F AUM & flows, characteristics, and fees, ensuring no aspect of your market analysis goes overlooked.
Market Mapping
Multi-dimensional classification system helps identify market gaps and product development opportunities.
Coverage
Sample MarketPulse Data Coverage
as of March 2025
Complete ETF Universe
» Every ETF enriched with comprehensive attributes, such as:
» Every ETF enriched with comprehensive attributes, such as:
- Top 10 holdings & sector weights (current)
- AUM & net flows (from inception)
- Fees and expenses breakdown (latest 10 years)
- Performance & risk (latest 10 calendar years; trailing since inception)
Owner Intelligence
» Cleansed 13F data attached to each ETF showing:
» Trended quarterly ownership starting in 2020
» Cleansed 13F data attached to each ETF showing:
- Historical AUM in each fund by owner
- Historical net flows by owner
- An owner’s complete list of ETF holdings over time
» Trended quarterly ownership starting in 2020
Total AUM
(all products & vehicles)
(all products & vehicles)
$
0
T
No. of Products
(retail & institutional)
(retail & institutional)
0
K
Active ETFs
(count)
(count)
0
+
Active ETFs
(AUM)
(AUM)
$
0
T