

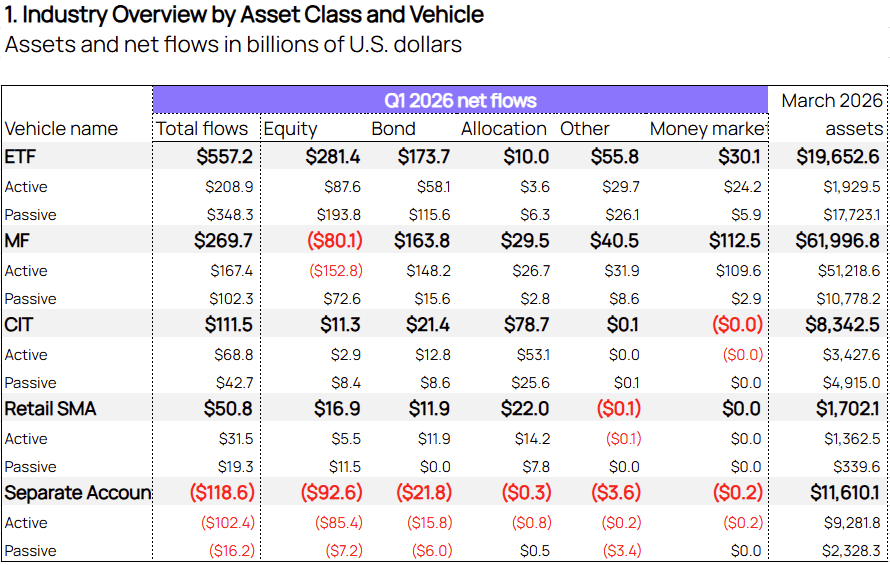
Managed vehicles recorded $870.5 billion in net inflows in Q1 2026, according to data from ISS MarketPulse powered by Simfund Total Market, marking a slowdown from the $1.2 trillion gathered in Q4 2025. ETFs remained the primary driver of industry flows, attracting $557.2 billion, or nearly two-thirds of total net deposits. Mutual funds followed with $269.7 billion in inflows, while CITs added $111.5 billion. Institutional separate accounts faced the harshest outflows for the quarter at $118.6 billion.
Source: ISS MI MarketPulse powered by Simfund Total Market.
Note: Includes funds of funds; other asset class includes alternatives and commodities.
Excludes variable annuities and unclassified vehicles.
ETFs remained the strongest source of net deposits in Q1 2026, gathering $557.2 billion, though down from $761.8 billion in Q4 2025. Equity ETFs were the main driver of growth, drawing $281.4 billion over the quarter. Passive ETFs captured the bulk of inflows at $348.3 billion. Even as active ETFs managed slightly over a tenth of passive ETF assets, their net commitments for the quarter were much closer at $208.9 billion. U.S.-domiciled ETFs accounted for the bulk of flows across both active and passive products, pulling in a collective $433.9 billion. Within passive ETFs, U.S.-based funds gathered $252.7 billion, followed by Ireland-domiciled products at $74.5 billion. The U.S. lead was even more pronounced among active ETFs, where U.S.-domiciled funds attracted $181.2 billion, compared with $8.8 billion for Ireland-based funds.
Mutual funds recorded the second highest quarterly inflows among major vehicles, totaling $269.7 billion, slightly below the $323.8 billion raised in Q4 2025. Flows were driven primarily by bond funds, which gathered $163.8 billion, followed by money market funds with $112.5 billion. Long-term flows recorded positive net deposits in the first quarter of $157.2 billion, a strong rebound from the $94.0 billion in outflows mutual funds faced when excluding money market funds. Equity mutual funds remained under pressure, posting $80.1 billion in net outflows, driven mainly by active equity funds, which shed $152.8 billion. Passive equity mutual funds partially offset those losses with $72.6 billion in inflows. U.S.-based equity funds saw the sharpest losses, with outflows totaling $149.3 billion for the quarter.
Collective investment trusts saw net commitments of $111.5 billion in Q1, down from $146.1 billion in Q4. Allocation funds, driven primarily by target-date funds, accounted for the bulk of inflows at $78.7 billion, up from $41.5 billion in the prior quarter. Bond funds were the second-largest contributor, adding $21.4 billion in net commitments, though this was below the $41.7 billion gathered in Q4. Equity funds also reported positive commitments of $11.3 billion. Active CITs accounted for a larger share of inflows than passive strategies, helped by strong demand for active allocation funds.
Retail separately managed accounts recorded $50.8 billion in inflows during the quarter, up from $43.4 billion in Q4. Allocation strategies led with $22.0 billion, nearly double the $11.4 billion gathered in the prior quarter. Equity strategies followed with $16.9 billion in inflows, down from $23.3 billion in Q4. Institutional separate accounts continued to face heavy redemptions, with net withdrawals surging to $118.6 billion, much harsher than Q4’s $40.4 billion. Within this segment, equity strategies suffered the most with massive outflows totaling $92.6 billion.
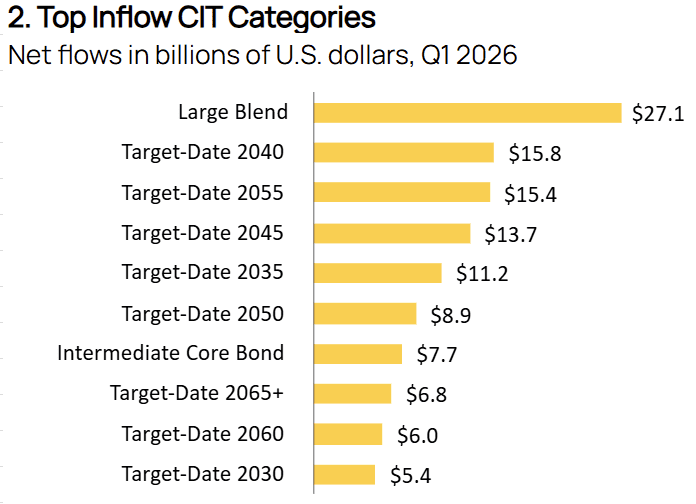
Large Blend remained the top inflow standalone CIT category in Q1 2026, bringing in $27.1 billion. While still substantial, demand eased from the exceptional $46.5 billion recorded in Q4. BlackRock led the Large Blend category with $7.2 billion in net commitments, a notable rebound from the $7.4 billion redeemed in the prior quarter. Most of the firm’s inflows were concentrated in passive strategies following the Russell 1000 and Russell 3000 indexes. Geode Capital Management added a further $5.7 billion, supported primarily by its Spartan 500 Index Pool. Outside equities, Intermediate Core Bond attracted $7.7 billion, lower than the $11.9 billion gathered in Q4. T. Rowe Price accounted for the largest share of inflows within the category ($3.8 billion), followed by Fidelity Investments ($2.6 billion).
Target-date strategies continued to drive CIT growth in Q1, occupying eight of the ten largest inflow categories, reflecting their central role in defined contribution retirement plans. Combined inflows across target-date CITs reached $80.0 billion, up sharply from $42.9 billion in Q4. Vanguard led the segment with $19.0 billion in inflows, followed by BlackRock ($16.3 billion) and Fidelity Investments ($15.3 billion).
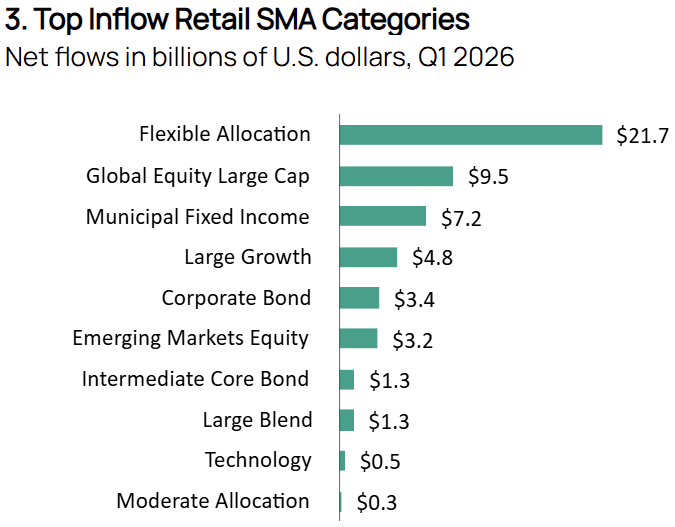
Retail SMA categories closed Q1 with net commitments of $50.8 billion, up from $43.4 billion in Q4, with the increase largely supported by stronger passive strategy flows. The top rankings included five equity strategies, three fixed income categories, and two allocation categories. Allocation strategies made the largest contribution to overall SMA flows, led by Flexible Allocation, which gathered $21.7 billion, up sharply from $12.7 billion in the prior quarter. BlackRock overwhelmingly led in the category, gathering $21.5 billion across a suite of multi-asset funds. The firm ultimately recorded the highest inflows of any SMA manager for the quarter at $29.1 billion, primarily on the back of allocation funds. Moderate Allocation also returned to positive territory, adding $255.5 million after outflows in Q4.
Within equities, Global Equity Large Cap stood out with $9.5 billion in inflows compared with $1.1 billion in Q4. Large-cap equity demand was otherwise positive but weaker than the prior quarter. Large Growth, for example, saw inflows of $7.2 billion in Q4 2025 slip to $4.8 billion in Q1 2026. JPMorgan served as the second-highest inflow manager for the quarter at $8.0 billion, driven primarily by Large Growth ($7.1 billion). Large Blend saw a more severe deceleration from net deposits of $16.9 billion in Q4 to $1.3 billion in Q1.
Municipal Fixed Income remained an important part of SMA demand, supported by the structure’s use in tax-loss harvesting. The category attracted $7.2 billion in Q1, up from $6.5 billion in Q4. Corporate Bond also gained momentum, with inflows rising to $3.4 billion from $1.6 billion, while Intermediate Core Bond added $1.3 billion, broadly in line with the prior quarter.
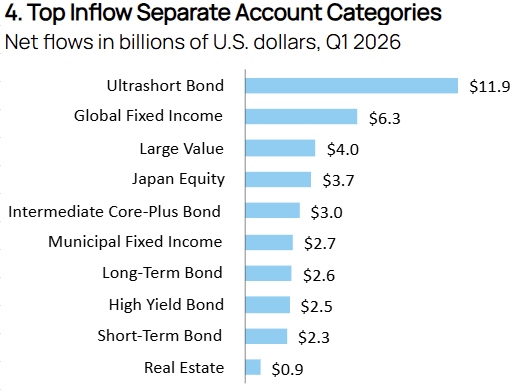
Fixed income continued to dominate institutional separate account inflows in Q1, accounting for seven of the top ten categories, although most bond categories attracted lower flows than in the previous quarter. Ultrashort Bond led all categories with $11.9 billion in net inflows, down from $14.0 billion in Q4, with JPMorgan driving the majority of activity at $8.7 billion. Global Fixed Income ranked second with $6.3 billion in inflows, compared with $7.8 billion in the prior quarter. Other fixed income categories remained positive but saw reduced momentum. Long-Term Bond saw net inflows decline from $5.8 billion in Q4 to $2.6 billion in Q1. Municipal Fixed Income experienced the sharpest decline among the leading categories, falling from $51.2 billion in Q4. However, not all fixed income segments weakened. High Yield Bond ($2.5 billion) and Short-Term Bond ($2.3 billion) posted notable recoveries from the outflows recorded in the previous quarter.
Net inflows outside of fixed income were largely concentrated in equity strategies. Large Value ranked third overall with inflows of $4.0 billion, marking one of the strongest turnarounds of the quarter after outflows of $29.0 billion in Q4. The Harris Associates U.S. Large Value strategy was the primary driver, attracting approximately $15.0 billion. Japan Equity gathered $3.7 billion after $2.7 billion in Q4, while Real Estate rounded out the top ten with inflows of $859.3 million, down from $1.6 billion in Q4.
We’re committed to bringing our clients ongoing insights from this expanded dataset and illustrating how this data enables firms to spot opportunities, analyze fund flows across vehicle types, or conduct customized benchmarking. Contact us here or through a Sales or Client Success representative, and visit our MarketPulse site to learn more.
Authors:
Alan Hess, Vice President, U.S. Fund Research, ISS Market Intelligence
Antara Maity, Senior Associate, U.S. Fund Research, ISS Market Intelligence
Aishwarya Mahalingam, Associate, U.S. Fund Research, ISS Market Intelligence