

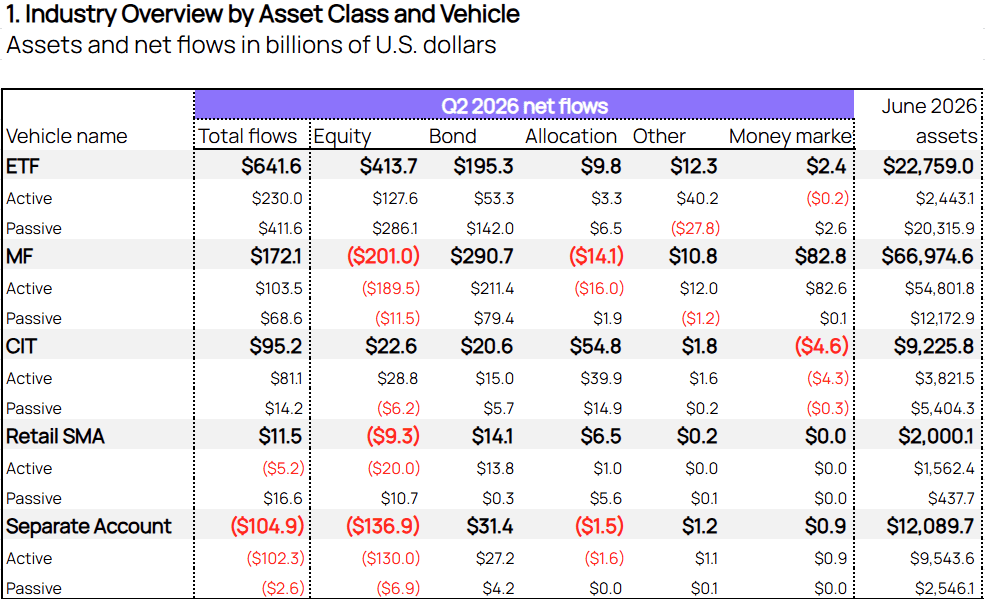
Managed vehicles attracted $815.5 billion in net inflows in Q2 2026, easing slightly from $842.8 billion in Q1, according to data from ISS MarketPulse powered by Simfund Total Market. ETFs continued to dominate industry sales, gathering $641.6 billion and accounting for nearly 80% of total net deposits. Mutual funds followed with $172.1 billion, while CITs attracted $95.2 billion. Retail SMAs remained positive, but inflows slowed sharply to $11.5 billion, while institutional separate account redemptions increased to $104.9 billion.
Source: ISS MI MarketPulse powered by Simfund Total Market.
Note: Includes funds of funds; other asset class includes alternatives and commodities.
Excludes variable annuities and unclassified vehicles
ETF inflows accelerated to $641.6 billion in Q2 2026 from $554.6 billion in the prior quarter, led by $413.7 billion in equity deposits. Passive strategies accounted for most of the ETF deposits, gathering $411.6 billion, while active ETFs attracted a substantial $230.0 billion despite managing effectively one-ninth of passive ETF assets. U.S.-domiciled products dominated flows across both segments. Among passive ETFs, U.S.-based funds gathered $347.2 billion, significantly ahead of the $92.0 billion attracted by Ireland-domiciled products. The disparity was even greater among active ETFs, where U.S.-domiciled funds collected $188.8 billion compared with $14.3 billion for Ireland-domiciled funds.
Mutual funds generated $172.1 billion in net inflows in Q2 2026, making them the second-largest recipient of investor assets among major vehicles, though well below the $312.1 billion collected in the previous quarter. Bond funds were the principal source of growth, collecting net inflows of $290.7 billion, including $211.4 billion in active strategies. These deposits were partially offset by $201.0 billion in equity fund outflows. While active funds led equity outflows ($189.5 billion), passive equity funds experienced a starker reversal from the prior quarter, moving from Q1 net deposits of $79.0 billion to Q2 net withdrawals of $11.5 billion. Redemptions additionally weighted on allocation funds, which moved from Q1 inflows of $41.6 billion to Q2 outflows of $16.0 billion. Persistent market volatility left money market fund inflows elevated at $89.3 billion, though below the $112.6 billion gathered in Q1. Flows into active funds were positive when excluding money market funds at $20.9 billion, but passive funds outpaced long-term active by gathering $68.5 billion for the quarter.
Collective investment trusts attracted $95.2 billion in net inflows in Q2 2026, a substantial increase from $22.0 billion in the prior quarter. Allocation strategies remained the largest source of deposits, gathering $54.8 billion, driven primarily by target-date funds. Equity and bond funds added $22.6 billion and $20.6 billion, respectively. Active CITs accounted for the majority of inflows, attracting $81.1 billion, while passive strategies contributed an additional $14.2 billion.
Retail separately managed account inflows slowed to $11.5 billion in Q2 2026 from $51.6 billion in the prior quarter. Bond and allocation strategies attracted $14.1 billion and $6.5 billion, respectively, partially offset by $9.3 billion in equity outflows. Institutional separate account redemptions increased to $104.9 billion from $97.4 billion in Q1. Equity strategies remained the primary source of withdrawals, losing $136.9 billion over the period. Redemptions remained overwhelmingly concentrated in active mandates, which saw $102.3 billion in outflows, compared with net withdrawals of $2.6 billion for passive strategies.
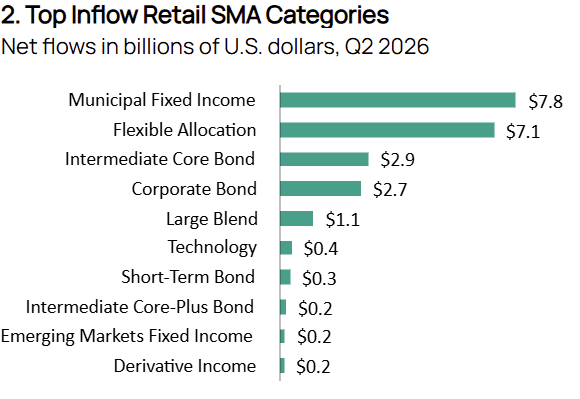
Retail SMA inflows slowed sharply to $11.5 billion in Q2 2026 from $51.6 billion in Q1, as active strategies reversed from $32.2 billion in inflows to $5.2 billion in net outflows. Passive strategies remained positive, attracting $16.6 billion during the quarter. Fixed income accounted for the majority of the leading inflow categories in the quarter at six. Municipal Fixed Income led with $7.8 billion in inflows, down from $10.2 billion in Q1. AllianceBernstein, Nuveen, and Lord Abbett were the category’s leading managers, each attracting more than $1 billion. Intermediate Core Bond and Corporate Bond attracted $2.9 billion and $2.7 billion, respectively, while Short-Term Bond returned to positive territory with $349.5 million.
Flexible Allocation ranked second overall with $7.1 billion in inflows, although deposits fell sharply from $21.5 billion in Q1. BlackRock led all retail SMA managers with $11.9 billion, primarily supported by $7.4 billion in Flexible Allocation strategies. Within equities, Large Blend stood out with $1.1 billion in inflows, in line with the $1.3 billion gathered in Q1. Morgan Stanley led the category at $3.6 billion. Technology followed with attracted $399.8 million in inflows.
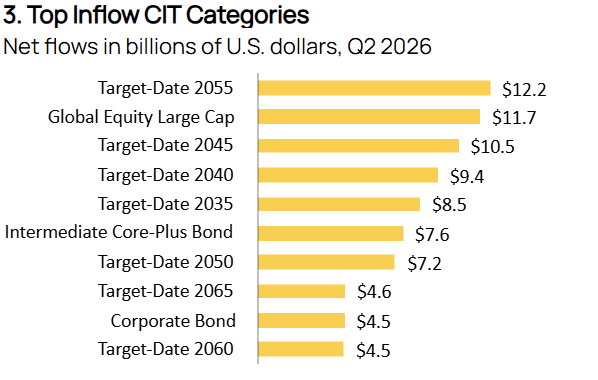
CIT inflows remained concentrated among target-date strategies in Q2 2026, which accounted for seven of the ten leading categories. Combined target-date CIT inflows reached $55.2 billion, slightly down from $58.3 billion in Q1. Capital Group led the segment with $16.5 billion in inflows, followed by Great Gray Trust ($13.2 billion) and Vanguard ($12.0 billion).
Global Equity Large was the top equity CIT category in Q2, attracting $11.7 billion after posting $40.7 billion in outflows in Q1, marking one of the quarter’s largest category reversals. BlackRock led the category with $2.8 billion in net commitments, a notable rebound from the $1.4 billion redeemed in the prior quarter, with most of the firm’s inflows coming from strategies tracking MSCI indexes. Geode Capital Management followed with $2.6 billion, entirely from passive strategies, supported primarily by its Spartan 500 Index Pool.
Outside of equities, Intermediate Core-Plus Bond inflows rose to $7.6 billion from $5.5 billion in Q1. BlackRock led the category with $1.8 billion, followed by Wellington ($1.3 billion) and Natixis ($1.1 billion), with all three managers’ inflows coming from active strategies. Corporate Bond net deposits more than doubled to $4.5 billion from $2.0 billion, with JPMorgan’s active strategies contributing $3.9 billion.
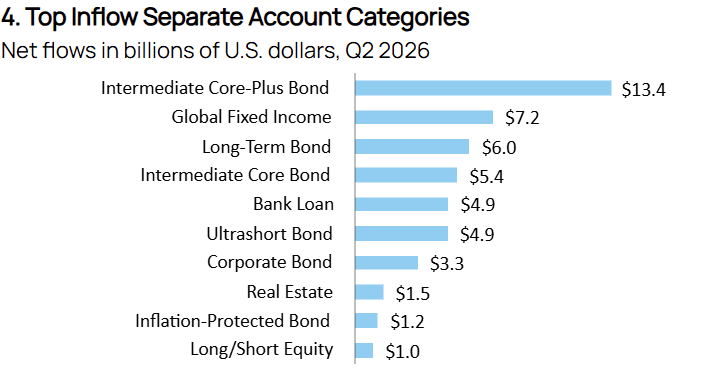
Fixed income dominated the leading institutional separate account categories in Q2, accounting for eight of the top ten, with most bond categories recording stronger inflows than in Q1. Intermediate Core-Plus Bond led with $13.4 billion, up sharply from $338.8 million. Franklin Templeton led in the category with inflows of $7.2 billion, reversing last quarter’s $756.7 million in outflows. Fidelity Investments followed with net contributions of $3.4 billion, up from $100.2 million in Q1. Global Fixed Income gathered the second most on a category level with $7.2 billion in inflows, while Long-Term Bond rebounded to $6.0 billion after recording $4.4 billion in outflows in Q1. Ultrashort Bond remained positive at $4.9 billion, though down from $10.4 billion. Inflation-Protected Bond returned to positive territory with $1.2 billion in inflows after recording $492.2 million in outflows in the prior quarter.
Beyond fixed income, Real Estate inflows increased to $1.5 billion in Q2 from $859.2 million in Q1. BlackRock and CenterSquare Investment Management led the category, gathering $1.4 billion and $1.3 billion, respectively. Meanwhile, Long/Short Equity, the only alternative category among the top ten, attracted $960.4 million, up from $120.7 million in Q1.
We’re committed to bringing our clients ongoing insights from this expanded dataset and illustrating how this data enables firms to spot opportunities, analyze fund flows across vehicle types, or conduct customized benchmarking. Contact us here or through a Sales or Client Success representative, and visit our MarketPulse site to learn more.
Authors:
Alan Hess, Vice President, U.S. Fund Research, ISS Market Intelligence
Antara Maity, Senior Associate, U.S. Fund Research, ISS Market Intelligence
Aishwarya Mahalingam, Associate, U.S. Fund Research, ISS Market Intelligence